Buckhead Demographics
Demographics
The geographic scope of Buckhead includes the community as defined by the Atlanta Regional Commission which is that portion of north Atlanta bounded by the city limits / DeKalb County line on the east; the city limits line on the north; the city limits / Cobb County line on the west; and the Peachtree Creek from the Chattahoochee River to Interstate 75, Interstate 75 to Interstate 85, and Interstate 85 to DeKalb County on the south. These boundaries correspond to the geographic purview of Buckhead Heritage.
Buckhead is a major driver of Atlanta’s and Georgia’s economy generating $2.9 Billion in gross annual retail sales – 40 percent of which are from visitors from more than 100 miles away. Buckhead has 23M square feet of commercial office development, 5,858 hotel rooms, an estimated 1,500 retail outlets, over 300 restaurants, 13 private schools, 33,763 multifamily residential units and 18,678 individual homes. 87,000 people live in Buck- head and the daytime population swells to an estimated 140,000 as workers, tourists and business people go about their day.
When considering Buckhead, there are two key comparisons that must be considered to understand the dynamics shaping the community. First is the difference between the daytime population and the residential base, and second is the interplay between the commercial core and the broader 20 square mile community.

Residential
Population
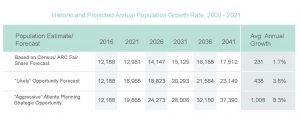
 The residential population base of greater Buckhead is currently about 87,000 and is expected to grow to nearly 114,000 by 2040. The residential growth is occurring in the urban core which is primarily high rise multifamily development. The Buckhead Core study area is home to an estimated 12,188 residents and 7,536 households. This represents approximately 14 percent of the population in the Greater Buckhead area and about three percent of the overall population and households in the City of Atlanta. The “Likely” opportunity forecast for the Buckhead Core calls for growth of 10,960 residents by 2041, based on historic Atlanta growth trends over the past 15 years documented in the U.S. Census, future growth trends, and on planned/proposed residential unit additions.
Diversity and Age
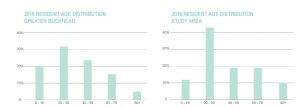 Currently the residential racial composition of greater Buckhead is with 77.5 percent white, eleven percent black, six percent Asian, three percent Other, and 2.2 percent two or more races. A total of seven percent of the population, regardless of race, that is Hispanic in origin is seven percent. The largest and fastest growing age sector in Buckhead is the 20-30 age bracket. This is particularly concentrated in the commercial core.
Income
Buckhead residents’ incomes are greater than the City of Atlanta overall in every age cohort. The workforce population is harder to define as most data sources do not capture demographics for the workforce. However, nearly 40% of the Buckhead Core’s estimated 68,500 employees work in industry sectors with average incomes of less $50,000. These numbers, in addition to commute pattern indicators, are the key to one of the underlying problems in the community – a lack of a wide range in housing options and price points to match the needs to of the workforce.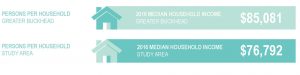

Workforce
Workforce
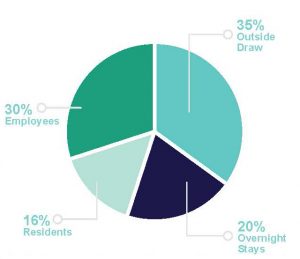
The daytime population of Buckhead swells to nearly double – an estimated 140,000 – every day due to incoming workforce, shoppers, tourists and others. 98 percent of the workforce travels in from somewhere else and the residential base also leaves the community destined for neighboring employment centers.
In addition to the mismatch between jobs and residents, there is another complicating factor
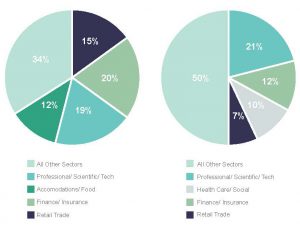
– a mismatch between salaries earned by the workforce and housing costs in the area. With the large presence of hospitality and retailing evident in the community, there is a significant percentage of entry level jobs which is often overlooked when considering the composition of Buckhead. 44 percent of the jobs in Buckhead offer salaries less than $40,000 per year. This, combined with a lack of diversity in the composition of our housing stock leads to a significant portion of the population that is unable to live in the community.
Commute
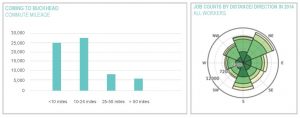
A mismatch between jobs and residents combined with a mismatch between housing prices and salaries inevitably adds up to one thing – a large portion of the workforce living outside the community and having to commute in from elsewhere. 98 percent of Buckhead’s workforce commutes in from other parts of the Atlanta and Metro Region every day. The combination of this fact with suburban style development patterns and a lacking grid system creates traffic. Most of the workforce coming to Buckhead travels between 10 and 24 miles to get to their jobs, however, in recent years, there has been a significant shift of the workforce moving closer to Buckhead opening the door to bicycling and walking as viable commute options.

Walk Score
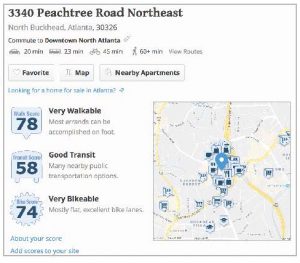
Developed at the height of the love affair with the automobile as an employment center anchored by a regional shopping mall and three major highways, Buckhead has had its challenges with walkability. However, significant strides have been made over time, the most notable being the redesign of Peachtree Road and the development of PATH400 greenway. The current walk score for Buckhead’s commercial core is a 73 which indicates significant room for improvement.

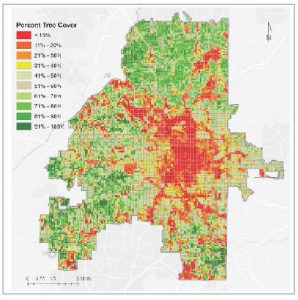
Tree Canopy
Tree canopy is a crucial element of what makes a city livable, both aesthetically and from a sustain- ability standpoint. A study conducted by the Georgia Institute of Technology (Georgia Tech) found that, “in October 2008, 47.9 percent (40,524 acres) of the land within the city limits was covered by urban tree canopy, 22.1 percent (18,722 acres) was covered by non-tree vegetation such as grass, shrubs, and other plants; and 30.0 percent (25,386 acres) was covered by non-vegetation such as paved surfaces and buildings.” According to Georgia Tech’s GIS program tracking tree canopy, the average percent tree cover across the city is 48 percent. Tree canopy coverage by NPUs representing Buckhead (in whole or in part) measures near or above average: NPU A: 71 percent, NPU B: 53 percent, NPU C: 65 percent, NPU D: 33 percent, NPU E: 27 percent, and NPU D: 46 percent.

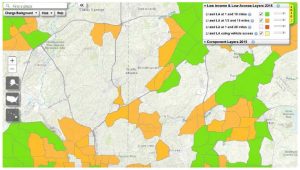
Food Deserts
The City of Atlanta’s Resilient Atlanta: Actions to Build an Equitable Future, identifies a target to ensure every Atlantan lives within one-half mile of fresh food by 2025. The U.S. Department of Agriculture (USDA) defines food deserts as neighborhoods that lack access to healthy food sources. Through their Food Access Research Atlas, they have mapped several indicators that measure and define food access in a community including: access to sources of healthy food measured by distance to food stores, family income and vehicle accessibility, and average neighborhood income and availability of public transportation.
When assessing Buckhead’s standing on the issue of access to healthy foods provided by the Food Access Research Atlas, there are two indicators that are taken into consideration. These include both the combined indicator sets that most closely align with the Resilient Atlanta half-mile goal defined as 1. “Low-income census tracts where a significant number or share of residents is more than 1/2 mile (urban) or 10 miles (rural) from the nearest supermarket” and 2. “Low-income census tract where more than 100 housing units do not have a vehicle and are more than ½ mile from the nearest supermarket, or a significant number or share of residents are more than 20 miles from the nearest supermarket.”
Based on these definitions, the Buckhead community has only one identified food desert. Based on this information, Livable Buckhead will seek to 1. Provide community members with a map that showcases where they can access healthy foods, and 2. Work with partners to assess appropriate action to be taken to close the one identified food desert and achieve standing as a food desert free community.